
Technical analysis is a method used by traders and investors to evaluate and forecast future price movements in financial markets. Unlike fundamental analysis, which focuses on a company’s financial health and intrinsic value, technical analysis relies on historical price data and trading volumes. The primary goal is to identify patterns, trends, and potential reversal points, aiding in decision-making for buying or selling assets. In this section, we’ll delve into the foundational aspects of technical analysis, exploring its definition, historical context, and its increasing relevance in today’s dynamic trading landscape. Understanding these fundamentals lays the groundwork for a more in-depth exploration of the intricacies of technical analysis.

Table of Contents
II. Benefits of Using Technical Analysis
In the ever-evolving world of trading, mastering the art of technical analysis can offer a multitude of advantages for investors and traders alike. This section will illuminate the various benefits associated with incorporating technical analysis into your trading toolkit.
A. Identifying Trends and Market Directions
Technical analysis excels in its ability to identify trends within financial markets. By scrutinizing historical price charts, traders can discern the prevailing direction of an asset’s price movement. Recognizing trends early on provides a crucial advantage, enabling traders to align their strategies with the prevailing market sentiment.
B. Timing Entry and Exit Points
Precise timing is often the key to successful trading, and technical analysis is a powerful tool for honing in on optimal entry and exit points. Through the analysis of chart patterns, indicators, and signals, traders can enhance their ability to make well-timed decisions, maximizing profit potential and minimizing losses.
C. Risk Management and Decision-Making
One of the underrated yet essential benefits of technical analysis is its role in risk management. By understanding key technical levels, such as support and resistance, traders can implement effective stop-loss orders and manage their risk exposure. Additionally, the visual nature of charts aids in informed decision-making, empowering traders to navigate the complexities of the market with confidence.
As we delve deeper into this section, we will explore each of these benefits in detail, providing insights into how technical analysis can be a game-changer in your trading endeavors. Whether you’re a novice or seasoned trader, leveraging these advantages can significantly enhance your ability to navigate the dynamic world of financial markets.
III. Performing Technical Analysis on Stocks
In the realm of trading, mastering the art of technical analysis is particularly crucial when dealing with individual stocks. This section will guide you through the process of performing technical analysis on stocks, offering insights into the fundamental principles that drive this analytical approach.
A. Basics of Stock Chart Analysis
At the heart of technical analysis lies the interpretation of stock charts. Understanding the basics of chart analysis involves recognizing different chart types, such as line charts, bar charts, and candlestick charts. We’ll explore how each type provides unique insights into price movements and trends, empowering you to make informed decisions when analyzing individual stocks.
B. Introduction to Candlestick Patterns
Candlestick patterns are a cornerstone of stock analysis, offering a visual representation of price action. From doji and engulfing patterns to hammer and shooting star formations, each candlestick conveys valuable information about market sentiment. This section will break down common candlestick patterns, enabling you to decipher their significance and integrate them into your stock analysis toolkit.
C. Recognizing Support and Resistance Levels
Identifying key support and resistance levels is essential for any stock trader. We’ll delve into the significance of these levels in technical analysis, exploring how they act as psychological barriers for prices. Armed with this knowledge, you’ll be equipped to make strategic decisions on entry, exit, and risk management, enhancing the precision of your stock trading strategies.
As we navigate through this section, you’ll gain practical insights into applying technical analysis specifically to stocks. Whether you’re interested in short-term trading or long-term investments, mastering these fundamentals will empower you to navigate the dynamic landscape of individual stock markets with confidence. Stay tuned for a comprehensive exploration of each sub-topic, providing you with actionable knowledge to elevate your stock trading proficiency.
IV. Key Principles of Technical Analysis
Delving into the world of technical analysis requires a solid understanding of its key principles. In this section, we’ll unravel the foundational concepts that underpin this analytical approach, providing you with a comprehensive grasp of the core principles shaping the dynamics of financial markets.
A. Dow Theory and its Relevance
Developed by Charles Dow, the Dow Theory is a cornerstone of technical analysis. We’ll explore its principles, including the concepts of trends, market indices confirmation, and the role of volume. Understanding Dow Theory is akin to unlocking a roadmap for interpreting market movements and making informed decisions based on underlying trends.
B. Efficient Market Hypothesis (EMH)
A critical aspect of technical analysis involves navigating the Efficient Market Hypothesis. We’ll discuss the three forms of EMH – weak, semi-strong, and strong – and their implications for traders. Unraveling the EMH will equip you with insights into the challenges and opportunities presented by market efficiency and how technical analysis adapts within this framework.
C. Role of Psychology in Technical Analysis
Beyond charts and indicators, the psychological aspect plays a pivotal role in technical analysis. This section will explore the impact of human emotions on market dynamics, including the concepts of fear, greed, and herd behavior. Understanding the psychology behind price movements is crucial for anticipating market shifts and making rational decisions in the face of market fluctuations.
As we navigate through this section, you’ll gain a deeper appreciation for the key principles that shape technical analysis. Whether you’re a seasoned trader or just embarking on your trading journey, these fundamental concepts will lay the groundwork for a nuanced understanding of market behavior. Stay tuned for detailed insights into each principle, providing you with actionable knowledge to elevate your technical analysis skills.
V. Best Practices for Applying Technical Analysis
Successfully incorporating technical analysis into your trading strategy goes beyond recognizing patterns and trends. This section will delve into the best practices that seasoned traders employ to optimize their use of technical analysis, ensuring a more robust and effective approach to navigating financial markets.
A. Using Multiple Indicators for Confirmation
While individual indicators offer valuable insights, combining multiple indicators can enhance the reliability of your analysis. We’ll explore how the synergy of indicators, such as moving averages, RSI, and MACD, can provide confirmation signals, reducing the likelihood of false positives and strengthening the overall robustness of your trading decisions.
B. Setting Up a Trading Plan Based on Technical Analysis
A structured trading plan is a linchpin for success in financial markets. This section will guide you through the process of crafting a comprehensive trading plan grounded in technical analysis. From defining entry and exit points to establishing risk-reward ratios, a well-designed trading plan can help you navigate the complexities of the market with discipline and precision.
C. Avoiding Common Pitfalls in Interpretation
Even the most seasoned traders can fall prey to common pitfalls when interpreting technical analysis signals. We’ll shed light on these pitfalls, including over-reliance on specific indicators, ignoring broader market trends, and succumbing to emotional biases. Understanding and sidestepping these pitfalls is essential for maintaining a clear-headed and strategic approach to technical analysis.
As we unravel the best practices in this section, you’ll gain actionable insights that can significantly impact the effectiveness of your technical analysis endeavors. Whether you’re a novice trader or an experienced investor, incorporating these practices into your trading routine can elevate your decision-making prowess and contribute to sustained success in the dynamic world of financial markets. Stay tuned for an in-depth exploration of each best practice, providing you with the tools to refine your technical analysis strategy.
VI. Common Technical Analysis Tools and Indicators
Navigating the vast landscape of technical analysis requires a thorough understanding of the tools and indicators at your disposal. In this section, we’ll delve into the common instruments that traders use to decipher market movements, providing you with a comprehensive toolkit to enhance your analytical capabilities.
A. Moving Averages
Moving averages are foundational in technical analysis, smoothing out price data to reveal underlying trends. We’ll explore the different types of moving averages, such as simple moving averages (SMA) and exponential moving averages (EMA). Understanding how moving averages signal trend direction and potential reversal points is crucial for making informed trading decisions.
B. Relative Strength Index (RSI)
The RSI is a momentum oscillator that gauges the speed and change of price movements. This section will break down how the RSI is calculated and how traders use it to identify overbought or oversold conditions. Harnessing the power of RSI can assist in anticipating trend reversals and fine-tuning entry and exit points.
C. Bollinger Bands and MACD
Bollinger Bands and the Moving Average Convergence Divergence (MACD) are dynamic indicators offering insights into volatility and momentum. We’ll delve into how Bollinger Bands encapsulate price movements and how MACD, with its signal and histogram components, aids in identifying trend changes. Understanding the nuances of these indicators can provide a holistic view of market conditions.
As we journey through this section, you’ll gain a comprehensive understanding of these common technical analysis tools. Whether you’re a novice trader or an experienced investor, incorporating these instruments into your analytical repertoire can significantly enhance your ability to interpret market dynamics and make informed decisions. Stay tuned for a detailed exploration of each tool, providing you with practical insights to elevate your technical analysis proficiency.
VII. Understanding Chart Patterns in Technical Analysis
Unlocking the potential of technical analysis involves a keen awareness of chart patterns, visual representations of price movements that signal potential trend reversals or continuations. In this section, we’ll delve into various chart patterns, providing you with the knowledge to decipher these formations and integrate them into your trading strategy.
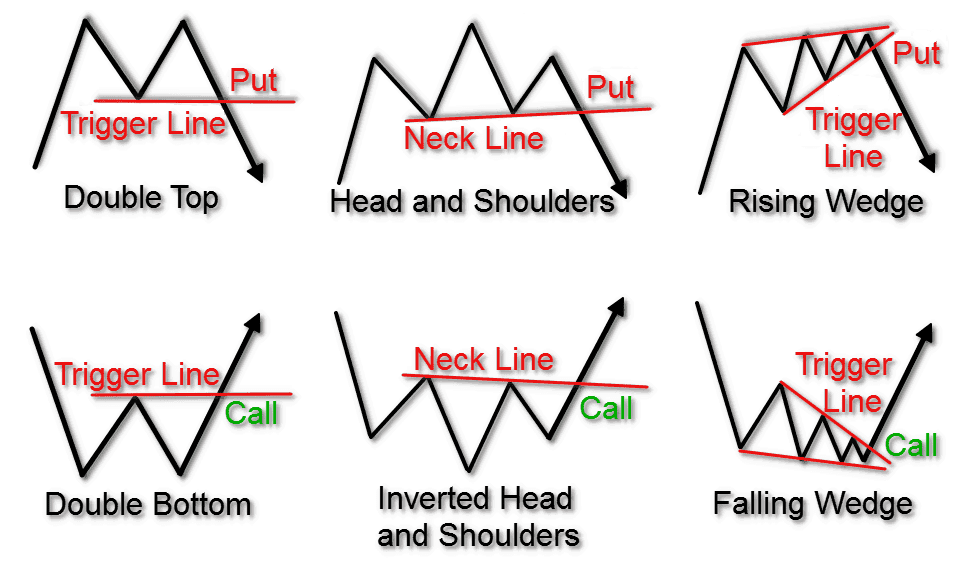
A. Head and Shoulders
The Head and Shoulders pattern is a classic reversal pattern that signals a potential change in trend direction. We’ll explore the anatomy of this pattern, distinguishing between the head, shoulders, and neckline. Understanding how to identify and interpret Head and Shoulders formations can empower you to anticipate trend reversals and make timely trading decisions.
B. Double Tops and Bottoms
Double Tops and Bottoms are reliable indicators of trend exhaustion. This section will unravel the characteristics of these patterns, showcasing how they manifest on price charts. Recognizing the symmetry and implications of Double Tops and Bottoms can be instrumental in refining your entry and exit points, adding precision to your trading strategy.
C. Triangles and Flags
Triangles and Flags are continuation patterns that signify a brief consolidation before the prevailing trend resumes. We’ll dissect the symmetrical, ascending, and descending triangle patterns, as well as bullish and bearish flag formations. Mastery of these patterns equips you with the tools to anticipate the market’s next move and optimize your trading decisions accordingly.
As we navigate through this section, you’ll gain a nuanced understanding of these chart patterns. Whether you’re a technical analysis enthusiast or a seasoned trader, incorporating these visual cues into your analytical toolkit can significantly enhance your ability to interpret market sentiment and make well-informed trading decisions. Stay tuned for an in-depth exploration of each chart pattern, providing you with actionable insights to elevate your technical analysis skills.
VIII. Technical Analysis vs. Fundamental Analysis in Trading
Distinguishing between technical analysis and fundamental analysis is pivotal for traders seeking a comprehensive approach to market analysis. In this section, we’ll explore the nuances of each methodology, providing insights into how they differ and how they can be integrated for a more holistic understanding of financial markets.
A. Overview of Fundamental Analysis
Fundamental analysis involves evaluating a security’s intrinsic value by examining various economic, financial, and qualitative factors. We’ll delve into key elements, such as earnings reports, financial statements, and economic indicators, which form the foundation of fundamental analysis. Understanding how fundamental factors drive market valuations is essential for long-term investors seeking value-oriented opportunities.
B. Contrasting Approaches and their Strengths
This section will highlight the distinctive features of technical and fundamental analysis. While technical analysis relies on historical price data and chart patterns, fundamental analysis delves into the underlying factors that influence an asset’s value. Contrasting these approaches illuminates the strengths and limitations of each, providing traders with the knowledge to choose or combine methodologies based on their unique trading objectives.
C. Integrating Both for Comprehensive Analysis
Striking a balance between technical and fundamental analysis can yield a more comprehensive view of the market. We’ll explore how savvy traders integrate these approaches, using technical analysis for short-term decision-making and fundamental analysis for long-term investment strategies. Understanding when and how to blend these methodologies can enhance the precision and robustness of your overall trading strategy.
As we progress through this section, you’ll gain valuable insights into the dynamic interplay between technical and fundamental analysis. Whether you’re a day trader, swing trader, or long-term investor, understanding the strengths of each approach and how they can complement each other is crucial for navigating the complexities of financial markets. Stay tuned for an in-depth exploration of each aspect, providing you with actionable knowledge to refine your analytical toolkit.
IX. Step-by-Step Guide to Mastering Technical Analysis
Embarking on the journey to master technical analysis requires a systematic approach and a solid understanding of the intricacies involved. In this section, we’ll provide a step-by-step guide that empowers both novice and experienced traders to navigate the complexities of technical analysis with confidence and proficiency.
A. Learning Resources and Educational Platforms
We’ll begin by exploring a variety of learning resources and educational platforms tailored for those eager to grasp technical analysis. From reputable online courses to comprehensive books and tutorials, identifying the right resources sets the foundation for acquiring a sound understanding of the principles and techniques underpinning technical analysis.
B. Practical Exercises and Case Studies
Hands-on experience is invaluable when mastering technical analysis. This section will guide you through practical exercises and real-world case studies, allowing you to apply theoretical knowledge to actual market scenarios. By analyzing historical price charts and making predictions based on technical indicators, you’ll refine your analytical skills and gain confidence in your ability to interpret market dynamics.
C. Continuous Improvement and Staying Updated
The world of financial markets is dynamic, and technical analysis methodologies evolve over time. We’ll explore strategies for continuous improvement, emphasizing the importance of staying updated on market trends, new indicators, and technological advancements. Adopting a mindset of continuous learning ensures that your technical analysis skills remain sharp and relevant in the ever-changing landscape of trading.
As we progress through this section, you’ll gain practical insights and actionable steps to accelerate your mastery of technical analysis. Whether you’re a beginner seeking to build a solid foundation or an experienced trader aiming to refine your skills, this step-by-step guide will provide you with the tools and knowledge to navigate the intricate world of technical analysis successfully. Stay tuned for an in-depth exploration of each step, offering you a roadmap to proficiency in technical analysis.
X. Impact of Technical Analysis on Cryptocurrency Trading
Cryptocurrency markets, known for their volatility and unique characteristics, present both opportunities and challenges for traders. In this section, we’ll delve into the specific nuances of applying technical analysis to cryptocurrency trading, offering insights into strategies tailored for this dynamic and rapidly evolving market.
A. Unique Considerations for Crypto Markets
Cryptocurrency markets operate 24/7, and their decentralized nature introduces unique considerations for technical analysis. We’ll explore factors such as liquidity, market sentiment, and the influence of external events, providing a comprehensive understanding of the dynamics that shape price movements in the crypto space.
B. Popular Technical Analysis Strategies for Cryptocurrencies
This section will highlight technical analysis strategies that have proven effective in the cryptocurrency realm. From identifying trends and chart patterns to utilizing crypto-specific indicators, we’ll equip you with the tools to navigate the complexities of digital asset markets and make well-informed trading decisions.
C. Risks and Opportunities in Crypto Trading
Cryptocurrency trading comes with its own set of risks and opportunities. We’ll discuss risk management strategies tailored for crypto markets, addressing factors like high volatility and market manipulation. Understanding the potential pitfalls and rewards of crypto trading ensures that you approach this exciting market with a well-informed and strategic mindset.
As we navigate through this section, you’ll gain valuable insights into the application of technical analysis in cryptocurrency trading. Whether you’re a seasoned crypto trader or exploring this market for the first time, understanding the unique dynamics and employing effective technical analysis strategies can enhance your ability to capitalize on opportunities and mitigate risks. Stay tuned for a detailed exploration of each sub-topic, providing you with actionable knowledge to navigate the crypto markets successfully.
XI. Technical Analysis Strategies for Day Trading
Day trading demands a unique set of strategies, leveraging the intraday volatility of financial markets. In this section, we’ll explore specific technical analysis strategies tailored for day traders, offering insights into short-term decision-making and maximizing opportunities within a single trading day.
A. Scalping and Short-Term Trading
Scalping is a popular day trading strategy involving the execution of numerous small trades to capitalize on minor price fluctuations. We’ll delve into the principles of scalping, including the use of tight stop-loss orders and rapid trade execution. Understanding how to navigate the fast-paced environment of short-term trading is crucial for day traders seeking to capitalize on intraday market movements.
B. Intraday Chart Patterns and Setups
Identifying and interpreting intraday chart patterns is a key aspect of day trading. We’ll explore patterns such as flags, pennants, and triangles that are particularly relevant in intraday timeframes. Recognizing these patterns allows day traders to make swift and informed decisions, optimizing entry and exit points within the constraints of a single trading session.
C. Managing Volatility in Day Trading
Volatility is inherent in day trading, presenting both opportunities and risks. This section will guide you through strategies for managing volatility, including the use of volatility indicators and adjusting position sizes based on market conditions. Effectively navigating volatility is crucial for day traders aiming to capitalize on price movements while minimizing exposure to sudden and unpredictable market swings.
As we journey through this section, you’ll gain practical insights into the specific strategies that define successful day trading through technical analysis. Whether you’re a seasoned day trader or exploring this approach for the first time, understanding the nuances of intraday strategies can significantly enhance your ability to thrive in the fast-paced world of day trading. Stay tuned for an in-depth exploration of each sub-topic, providing you with actionable knowledge to refine your day trading strategy.
XII. Risk Management and Technical Analysis in Stock Markets
Effectively managing risks is a cornerstone of successful trading, and integrating risk management strategies with technical analysis is paramount. In this section, we’ll explore how traders can employ risk management techniques within the context of technical analysis when navigating the stock markets.
A. Setting Stop-Loss Orders
Setting precise stop-loss orders is a fundamental aspect of risk management in stock trading. We’ll delve into how technical analysis aids in determining optimal stop-loss levels, considering support and resistance levels, volatility, and technical indicators. Understanding how to strategically place stop-loss orders ensures that traders limit potential losses and protect their capital.
B. Calculating Position Sizes
Determining the appropriate size of a trading position is critical for managing risk. This section will guide you through the principles of position sizing using technical analysis. Factors such as account size, risk tolerance, and market volatility play a role in determining the optimal position size, and understanding these dynamics is essential for preserving capital in the face of market fluctuations.
C. Adapting Strategies to Different Market Conditions
Stock markets can experience various conditions, ranging from trending to ranging or volatile environments. We’ll explore how technical analysis can assist traders in adapting their strategies to different market conditions. Whether employing trend-following strategies during strong trends or mean-reverting strategies in choppy markets, understanding how technical analysis aligns with market conditions is crucial for consistent performance.
As we traverse through this section, you’ll gain valuable insights into the integration of risk management principles with technical analysis in stock trading. Whether you’re a novice trader or an experienced investor, mastering these risk management techniques enhances your ability to navigate the complexities of the stock markets with resilience and discipline. Stay tuned for a detailed exploration of each sub-topic, providing you with actionable knowledge to refine your risk management strategies.
XIII. Psychology of Trading and its Relation to Technical Analysis
Understanding the psychological aspects of trading is as crucial as mastering technical analysis. In this section, we’ll explore the intricate connection between psychology and technical analysis, shedding light on how emotions can influence decision-making and offering strategies to maintain a disciplined mindset in the ever-changing world of financial markets.
A. Overcoming Emotional Biases
Emotions play a significant role in trading, and recognizing and overcoming emotional biases is paramount for success. We’ll delve into common emotional biases such as fear, greed, and overconfidence, examining how these biases can impact trading decisions. Strategies to manage and mitigate emotional biases will be discussed, empowering traders to make rational and informed choices.
B. Discipline and Patience in Trading
Discipline and patience are virtues that define successful traders. This section will explore how technical analysis contributes to fostering discipline and patience. From sticking to predefined trading plans to waiting for confirmation signals, understanding the role of discipline and patience in the context of technical analysis is crucial for navigating the ups and downs of the market with resilience.
C. Mindset for Long-Term Success
Maintaining a mindset geared towards long-term success is the ultimate goal for traders. We’ll discuss how technical analysis can contribute to developing a mindset focused on continuous improvement and adaptability. Learning from both successes and failures, setting realistic expectations, and embracing a growth mindset are essential components for achieving sustainable success in trading.
As we progress through this section, you’ll gain a profound understanding of the psychological aspects intertwined with technical analysis. Whether you’re a seasoned trader or just starting, mastering the psychological aspects of trading can significantly enhance your ability to make informed decisions and navigate the dynamic world of financial markets with resilience and confidence. Stay tuned for a detailed exploration of each sub-topic, providing you with actionable insights to refine your trading psychology.
XIV. Advanced Technical Analysis Techniques for Investors
For investors seeking a deeper understanding of market dynamics and aiming for long-term success, advanced technical analysis techniques offer valuable insights. In this section, we’ll delve into sophisticated tools and strategies that go beyond the basics, providing investors with a comprehensive toolkit to make informed decisions in various market conditions.
A. Fibonacci Retracement and Extension
Fibonacci retracement and extension levels are powerful tools for identifying potential reversal points and price targets. We’ll explore the principles behind Fibonacci sequences and how to apply retracement and extension tools on price charts. Understanding how Fibonacci levels align with key support and resistance zones enhances an investor’s ability to anticipate market movements with precision.
B. Elliott Wave Theory
Elliott Wave Theory is a complex yet insightful tool for understanding market cycles and trends. This section will unravel the principles of Elliott Wave analysis, including impulse waves and corrective waves. Investors will gain insights into how this theory can be applied to identify trend structures and potential reversal points, offering a nuanced perspective on market movements.
C. Harmonic Patterns
Harmonic patterns, such as the Gartley and Butterfly patterns, provide a unique approach to identifying potential reversal zones. We’ll explore the principles behind harmonic patterns and how to recognize these formations on price charts. Integrating harmonic patterns into technical analysis allows investors to pinpoint areas of price exhaustion and make strategic decisions based on these advanced signals.
As we navigate through this section, investors will gain a deeper understanding of advanced technical analysis techniques. Whether you’re a seasoned investor or someone looking to enhance your analytical skills, incorporating these advanced tools into your strategy can significantly elevate your ability to make well-informed investment decisions. Stay tuned for a detailed exploration of each sub-topic, providing you with actionable insights to refine your technical analysis proficiency.
XV. Real-World Examples of Successful Technical Analysis Trades
Learning from real-world examples is a powerful way to understand the practical application of technical analysis in trading. In this section, we’ll dive into case studies and success stories, examining how traders have effectively utilized technical analysis to make informed decisions and achieve profitability in diverse market conditions.
A. Case Studies of Profitable Trades
We’ll analyze specific instances where traders successfully applied technical analysis to identify opportunities and execute profitable trades. These case studies will showcase the application of various technical indicators, chart patterns, and strategies in real market scenarios. Understanding the thought process behind each trade offers valuable insights for traders looking to replicate success in their own portfolios.
B. Lessons Learned from Past Market Trends
Examining past market trends provides a historical perspective on the effectiveness of technical analysis. We’ll explore instances where technical analysis accurately predicted trend reversals, breakouts, or trend continuations. Extracting lessons from these historical trends equips traders with knowledge to navigate current and future market conditions with a more informed and strategic approach.
C. Insights from Experienced Traders
In this section, we’ll incorporate insights and anecdotes from experienced traders who have successfully integrated technical analysis into their trading strategies. Learning from the practical experiences of seasoned traders offers valuable perspectives, highlighting the challenges faced, strategies employed, and key takeaways that contribute to long-term success in the dynamic world of financial markets.
As we traverse through this section, traders will gain practical insights and inspiration from real-world examples of successful technical analysis trades. Whether you’re a novice trader or an experienced investor, understanding how others have applied technical analysis in diverse market situations can serve as a valuable source of knowledge and inspiration. Stay tuned for a detailed exploration of each sub-topic, providing you with actionable insights to enhance your technical analysis skills.
XVI. The Future of Technical Analysis: Emerging Trends and Innovations
As financial markets evolve, so does the field of technical analysis. In this section, we’ll explore the future of technical analysis, delving into emerging trends and innovations that are shaping the landscape of market analysis. From advancements in artificial intelligence to the integration of big data, this section will provide a glimpse into the cutting-edge developments that traders and investors can anticipate in the ever-evolving world of financial markets. Stay tuned for insights into the tools and techniques that will define the future of technical analysis.
XVII. Conclusion: Mastering Technical Analysis for Market Success
In this concluding section, we summarize the key takeaways from our exploration of technical analysis. From foundational principles to advanced strategies, we’ve covered a comprehensive range of topics to empower traders and investors. Whether you’re a beginner seeking to build a solid foundation or an experienced professional looking to refine your skills, mastering technical analysis is a continuous journey. The insights gained from this guide will serve as a valuable resource as you navigate the dynamic and ever-changing landscape of financial markets. Stay tuned for more updates and happy trading!
Frequently Asked Questions (FAQs) on Technical Analysis:
Q1: What is technical analysis, and how does it differ from fundamental analysis?
A1: Technical analysis is a method of evaluating securities by analyzing statistical trends and historical price and volume data. Unlike fundamental analysis, which focuses on a company’s financial health, technical analysis relies on chart patterns and indicators to predict future price movements.
Q2: Can technical analysis be applied to different financial markets?
A2: Yes, technical analysis can be applied to various financial markets, including stocks, forex, commodities, and cryptocurrencies. The principles of technical analysis are versatile and can be adapted to different asset classes.
Q3: How can I learn technical analysis?
A3: Learning technical analysis involves studying chart patterns, indicators, and strategies. Resources such as online courses, books, and tutorials are available to help beginners grasp the fundamentals. Practical experience and continuous learning are essential for mastery.
Q4: What are some common technical analysis tools and indicators?
A4: Common tools and indicators include moving averages, RSI (Relative Strength Index), MACD (Moving Average Convergence Divergence), Bollinger Bands, and Fibonacci retracement levels. These tools help identify trends, momentum, and potential reversal points.
Q5: Is technical analysis suitable for long-term investors?
A5: While technical analysis is often associated with short-term trading, long-term investors can also benefit. Technical analysis can aid in timing entry and exit points, managing risks, and identifying long-term trends.
Q6: How does psychology influence technical analysis?
A6: Psychology plays a significant role in trading. Emotions like fear and greed can impact decision-making. Recognizing and managing emotional biases is crucial for successful application of technical analysis.
Q7: Are there advanced techniques in technical analysis?
A7: Yes, advanced techniques include Fibonacci extensions, Elliott Wave Theory, and harmonic patterns. These tools provide more sophisticated ways to identify potential reversal points and forecast market movements.
Q8: What is the future of technical analysis?
A8: The future of technical analysis involves innovations such as artificial intelligence, machine learning, and big data analysis. These advancements aim to enhance the accuracy and efficiency of market analysis.
Q9: Can technical analysis be automated?
A9: Yes, many traders use automated trading systems or algorithms based on technical analysis. These systems can execute trades based on predefined criteria, providing a systematic approach to trading.
Q10: Is technical analysis guaranteed to predict market movements accurately?
A10: No, technical analysis does not guarantee accurate predictions. It is a tool that aids in decision-making based on historical data and patterns. Traders should use technical analysis in conjunction with risk management strategies and stay informed about market conditions.

